Colonic ecosystem by pH
Companion chart to Chapter 22 — Stool pH controls microbiome content
pH is a proxy for the competitive balance between saccharolytic and proteolytic fermentation. Low pH = high SCFA production, high protonation, strong gram-negative suppression. High pH = low SCFA, deprotonated, Enterobacteriaceae unsuppressed. Healthy volunteer stool pH: 6.6 +/- 0.3. Functional optimum for butyrate production and antimicrobial suppression: stool pH ~6.0.
Panel A — Population activity (ecological succession, left to right)
LAB and Actinobacteria (Lactobacillus, Bifidobacterium)
Saccharolytic Firmicutes (butyrate producers)
Bacteroidetes (tolerogenic LPS)
TGN / urease (Enterobacteriaceae)
Panel B — Metabolite outputs
Butyrate
Acetate / propionate
Lactate / pathological acids (3 peaks: cross-feeder failure / healthy relay flux / D-lactate + formic + succinic acid collapse)
Ammonia
Toxic BCFA + biogenic amines (isobutyrate, isovalerate, cadaverine, putrescine, histamine, tyramine)
Panel C — Relative survival (inverted from Osuka et al. 2012, ICU SIRS patients, n=138)
Relative survival (Osuka 2012, n=138 ICU SIRS)
Bacteremia-free survival
Caution: ICU SIRS patients, not a healthy population. Acidic stool in this cohort reflects pathological fermentation (D-lactate, succinate, formate), not healthy SCFA production. A healthy person with stool pH 5.8 producing butyrate is in a completely different metabolic state from an ICU patient at pH 5.8 accumulating lactate. The number is identical. The clinical meaning is opposite.
LAB and Actinobacteria
Lactobacillus spp. (Firmicutes)
Bifidobacterium spp. (Actinobacteria)
Bifidobacterium spp. (Actinobacteria)
Output: lactate
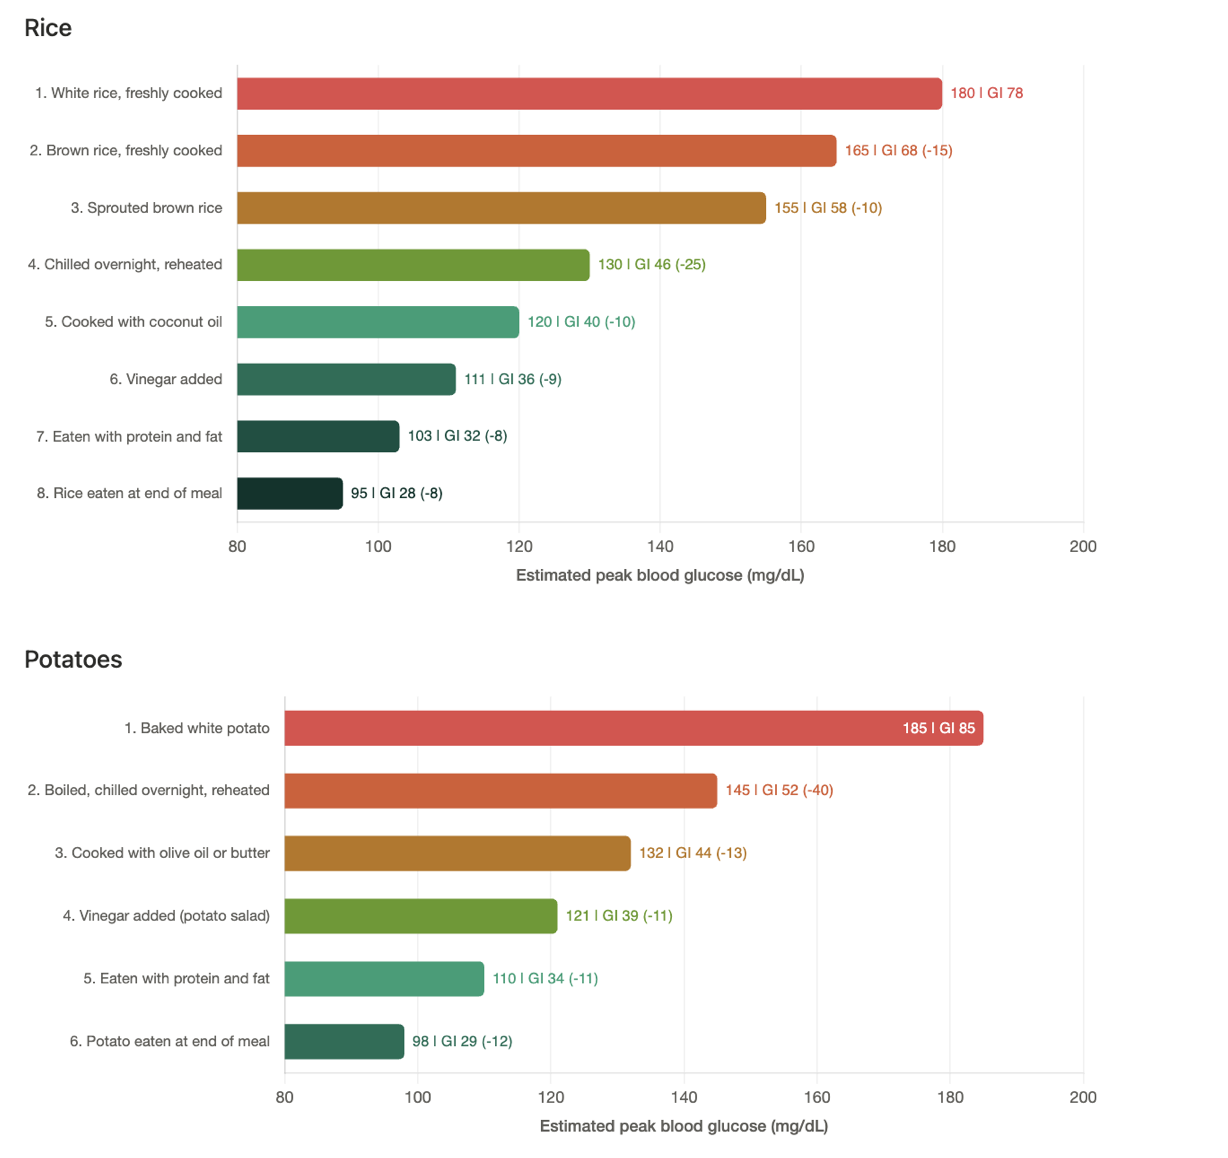
Input: prebiotics (FOS, GOS, inulin, XOS) — heat-stable, independent of cooking method
Saccharolytic Firmicutes
F. prausnitzii, Roseburia spp.
E. rectale, Clostridium IV/XIVa
E. hallii, Anaerostipes (cross-feeders)
E. rectale, Clostridium IV/XIVa
E. hallii, Anaerostipes (cross-feeders)
Output: butyrate (the relay endpoint)
Input: lactate + acetate (cross-feeding), resistant starch, specific fermentable fibers
Bacteroidetes
Bacteroides spp.
Prevotella spp.
Prevotella spp.
Output: acetate, propionate (via succinate pathway). No butyrate.
LPS: tolerogenic
LPS: tolerogenic
Input: complex plant polysaccharides, mucin glycans, resistant starch (direct PUL-mediated degradation — independent pathway, not part of lactate relay)
TGN / Urease
Klebsiella spp., Proteus spp.
Morganella spp., pathogenic E. coli
Enterobacter spp.
Morganella spp., pathogenic E. coli
Enterobacter spp.
Output: ammonia (urease), toxic BCFA (isobutyrate, isovalerate), biogenic amines (cadaverine, putrescine, histamine, tyramine)
LPS: inflammatory
LPS: inflammatory
Input: undigested/endogenous protein reaching colon, blood urea (diffuses from circulation — independent of diet)
Reading the chart: Panels A and B share the same x-axis. At any pH, read vertically to see which populations are active (Panel A) and what they are producing (Panel B). At pH 6.0: Firmicutes dominate, butyrate peaks, ammonia is at baseline, SCFA protonation is strong. At pH 6.5: Bacteroidetes have overtaken Firmicutes, butyrate is declining, the TGN sigmoid is beginning to lift. At pH 7.0+: the positive feedback loop is active — ammonia rising, butyrate collapsed, toxic BCFA and biogenic amines appearing. Panel C shows the survival consequence: peak survival near pH 6.5 in the Osuka ICU cohort, dropping sharply on both sides for different reasons.
The SCFA antimicrobial mechanism: The protonated (undissociated) form of SCFAs penetrates gram-negative membranes and acidifies the bacterial cytoplasm. This form only exists in sufficient quantity at acidic pH. As pH rises, SCFAs deprotonate, lose membrane-penetrating ability, and Enterobacteriaceae escape suppression. pH does not suppress these organisms directly — the protonated SCFAs do. The pH tells the practitioner whether the weapon is loaded.
The positive feedback loop: Above ~pH 6.5: urease output rises (enzyme optimum ~7.4) → ammonia produced → pH rises → SCFA deprotonates → antimicrobial pressure drops → more Enterobacteriaceae grow → more urease → more ammonia. Self-accelerating. Breaking it requires intervention at multiple points simultaneously.
The lactate-to-butyrate relay and the three lactate peaks: The lactate curve in Panel B shows three distinct peaks. The small middle peak (~pH 5.8) is healthy: LAB produce lactate and the cross-feeders consume it as fast as it is made — steady-state flux through the relay, never accumulating. The acidic peak (~pH 5.0) is cross-feeder failure: LAB are still producing lactate but the Firmicutes cross-feeders (E. hallii, Anaerostipes) have been depleted, typically by antibiotics. Lactate accumulates because the receiving end of the relay is gone. Lactic acid (pKa 3.86, stronger than SCFAs at pKa ~4.8) drives pH lower than healthy SCFA acidification — same low number, different pathology. The alkaline peak (~pH 7.5) is D-lactate from ecosystem collapse: pathological fermentation by different organisms producing D-lactic acid, succinic acid, and formic acid. This is the critically ill patient's acidic stool — not the relay at all. Bacteroidetes are not part of the relay at any pH.
Studies driving the chart
- Osuka et al. 2012 — Crit Care 16:R119. PMC3580696 — Panel C survival curve. 138 SIRS patients. Normal range 6.0–7.2. Healthy volunteers 6.6 +/- 0.3. Mortality OR 2.46, bacteremia OR 3.25 per unit deviation. Acidic feces: lactate, succinate, formate elevated. Propionic acid decreased in both extremes.
- Duncan et al. 2009 — Environ Microbiol 11(8):2112. Wiley — Panel A succession. 33 bacteria at pH 5.5, 6.2, 6.7. Bacteroides 86% at 6.7, butyrate gram-positives 50% at 5.5.
- Sorbara et al. 2019 — J Exp Med 216(1):84. PMC6314524 — SCFA mechanism. Inhibition requires BOTH acidic pH + SCFAs. Protonated SCFAs penetrate gram-negative membranes.
- Cummings et al. 1987 — Gut 28:1221. PMC1433442 — Regional pH: cecum 5.6 to descending colon 6.6. SCFA 70–140 mM ascending, 20–40 mM descending.
- Macfarlane et al. 1992 — J Appl Bacteriol 72:57. — Proteolytic products increase from right to left colon.
- Shimizu et al. 2006 — J Trauma 60:126. PubMed — SIRS dysbiosis: 2–4 log fewer Bifidobacterium/Lactobacillus, elevated pH.
- Cremer et al. 2017 — PNAS 114:6438. PNAS — Differential pH feedback: Firmicutes vs Bacteroidetes.
- Chng et al. 2024 — mSphere 9:e00781-23. PMC10900885 — SCFA chain-length inhibition: butyrate > propionate > acetate on Enterobacteriaceae.
- Flint et al. 2020 — mSystems 5:e00645-20. PMC7483512 — Lactate relay. Lactate-utilizing bacteria as keystone species.
- Frontiers in Microbiomes 2023 — 2:1192316. Frontiers — Review. Fecal pH below 6.0 and above 7.2 correlates with mortality/bacteremia.